
Product & PlatformAnupam Chaudhary & Sanchit Kathpalia
Ainyx Graph Builder
Drag a service architecture together and watch it price itself.
- Year
- 2026
- Stack
- ReactViteReact FlowZustandTanStack QueryTailwind CSS
The brief
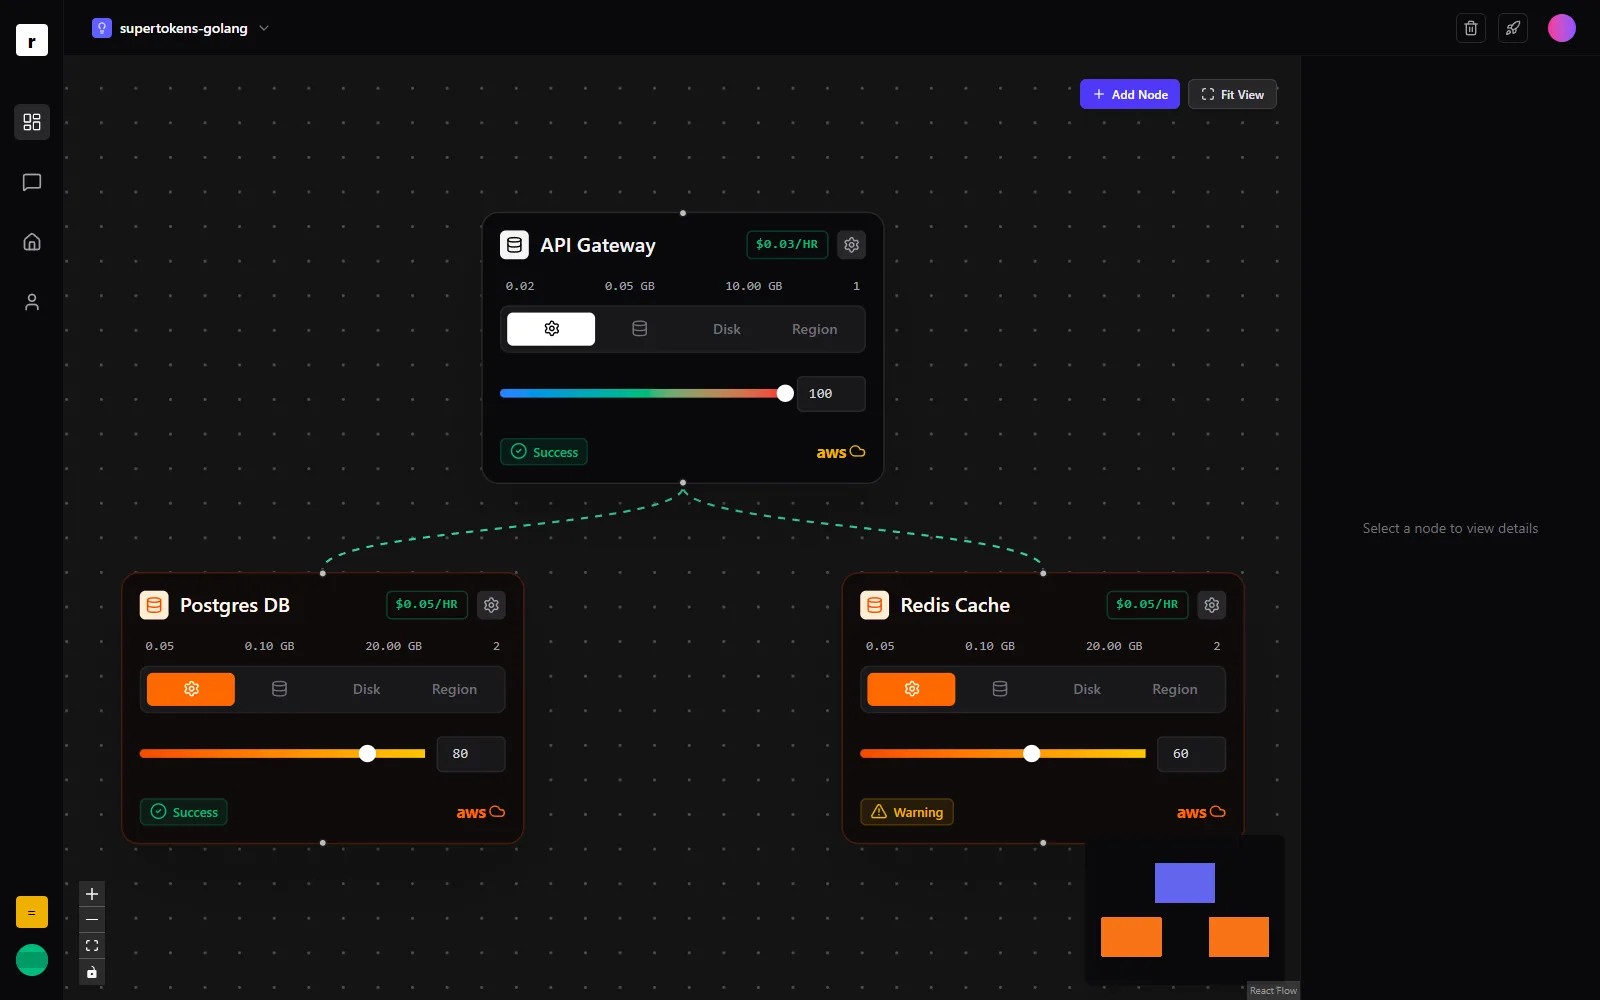
An architecture canvas you drag together while the cost recalculates underneath you. It stays in the portfolio because the interaction problem is a good one and the result holds up.
The challenge
An architecture canvas has to stay responsive while the user drags nodes, edits configuration, and watches costs recalculate — with dozens of nodes on screen. Naive state handling re-renders the whole graph on every keystroke and the canvas turns to glue.
The approach
React Flow for the canvas, Zustand for state so only the affected node re-renders, and TanStack Query for data. Each node carries its own configuration and shows a live per-hour cost as it's tuned.
What we built
- Interactive node-graph editor
- Per-node configuration with live cost
- Smooth pan and zoom with many nodes
- Per-service status indicators
What it demonstrates
- Canvas-based interfaces that stay smooth under interaction
- State architecture chosen to avoid unnecessary re-renders
- Turning a loose brief into a working, opinionated tool